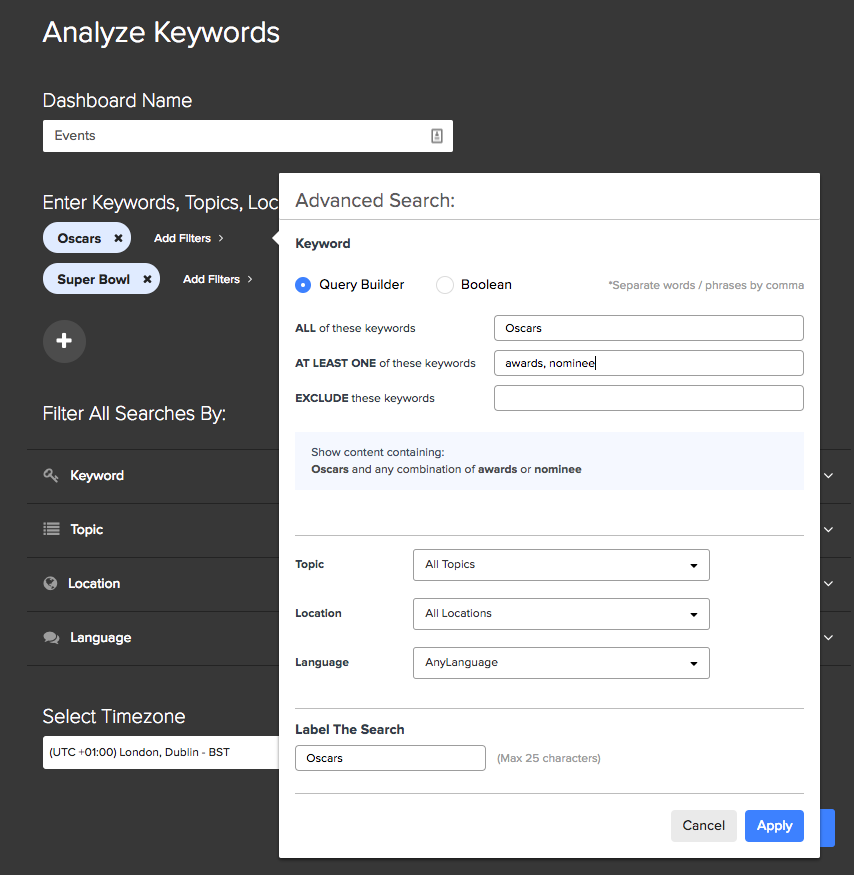
To track keywords, create a dashboard using the "Analyze Keywords" option. Search for mentions of keywords and apply advanced filters to narrow down the content by language or location:

Use the query builder to make your search more specific or exclude any keywords from the Facebook pages which you've selected.
Double check your search query by looking at the summary in the light blue box right below your search parameters to see how Analytics is interpreting your keyword searches.
You can also search using Boolean, using the operators AND, OR, NOT, or further refine your query by entering topic, location, or language filters.
After pressing the "Create Dashboard" button, navigate over to the "Posted on Facebook" tab to monitor the use of keywords on Facebook.

In this dashboard, view the performance of keywords over time, understand the Facebook posts and pages that have done especially well, as well as understand the formats that have been working best.
Post Type Breakdown- Interactions Chart
The Post Type Breakdown table shows the social engagement for each type of Facebook post mentioning the keywords selected.
The table includes video, photo, link, status, and event post engagements.
Change the view between total engagement, average engagement, and post count. You can also filter on engagement type to see a breakout for likes or comments.
This is a great way to see how each post type performed overall when compared to others.

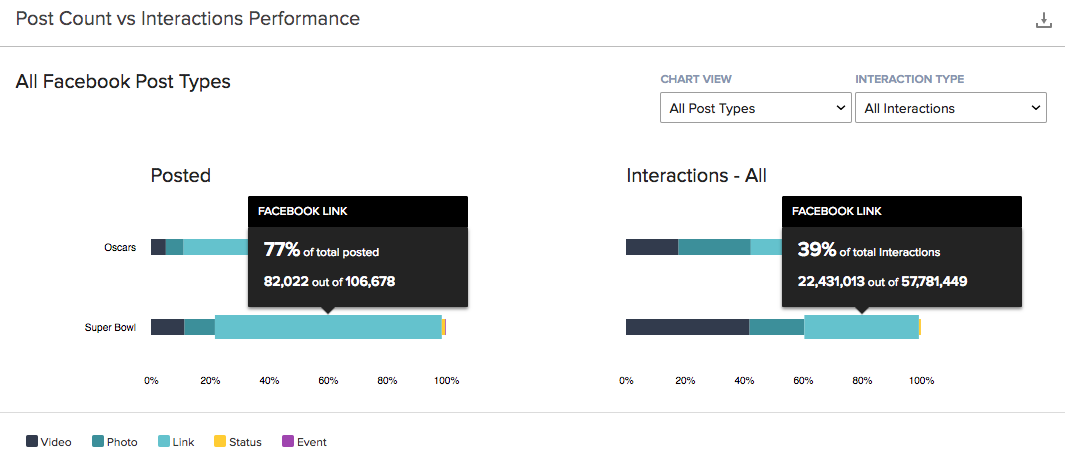
Post Count vs Engagement Performance Chart
This chart provides a clear view into the post to engagement ratio by post type for each keyword. For example, quickly see the percentage of video posts for a keyword compared to the percentage of total engagement on these posts.

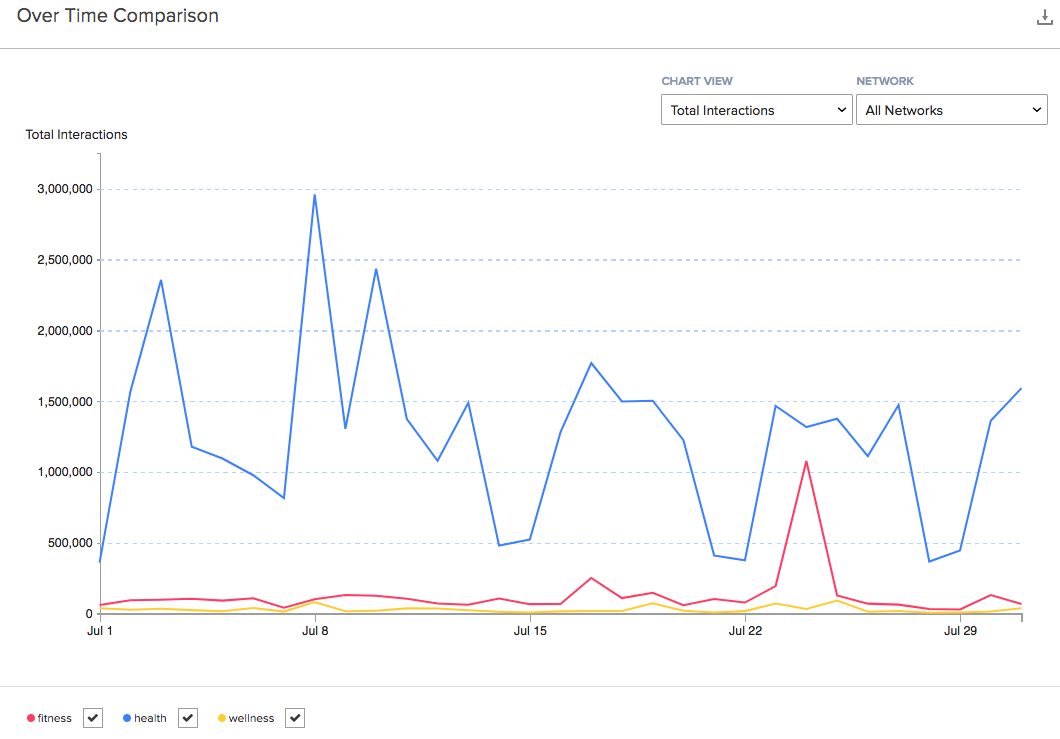
Over Time Comparison Chart
This chart shows engagement over time. You can see when notable spikes of engagement occurred and break out the specific posts that caused the spikes.
Highlight a specific spike by clicking directly on the graph or click-drag-release your mouse to highlight an entire area of the graph. The Content Panel will expand to show the posts in this timeframe.
Change the chart view, post type, and engagement type to adjust the results in your chart.

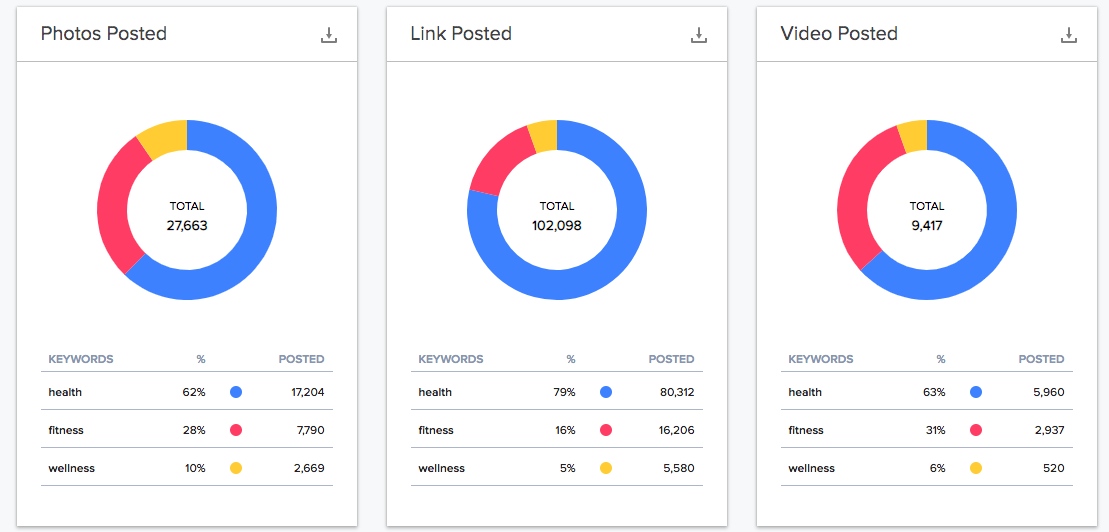
Post Type Breakdown Charts
These charts show the volume of posts by post type for each Facebook page.

Comments
Please sign in to leave a comment.