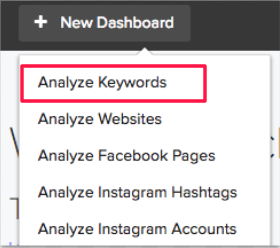
When you log into Analytics, click on the “New Dashboard” button and select the option to “Analyze Keywords” from the drop-down:

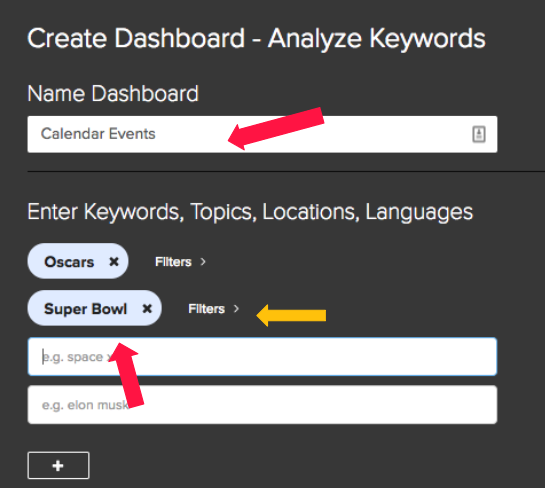
Input the name of the Dashboard, and the keywords in which you are interested. For more advanced searching, click on the “Filters” link to the right of the keyword:

You can use the query builder to make your search more specific. For example, if you’re searching for the keywords Super Bowl and also want mentions of the half time show, you can add half time show as a modifier to the “Any of these words” search box:

Similarly, if you want to exclude any results for the “half time show”, you can add it to the “None of these words” box.
Double check your search query by looking at the summary in the light blue box right below your search parameters to see how Analytics is interpreting your keyword searches.
You can also search by switching to the Boolean tab where you can use the Boolean operators AND, OR, NOT, parentheses and quotation marks for exact phrases:

Please refer to the Boolean FAQ for more information on how to create more advanced Boolean searches.
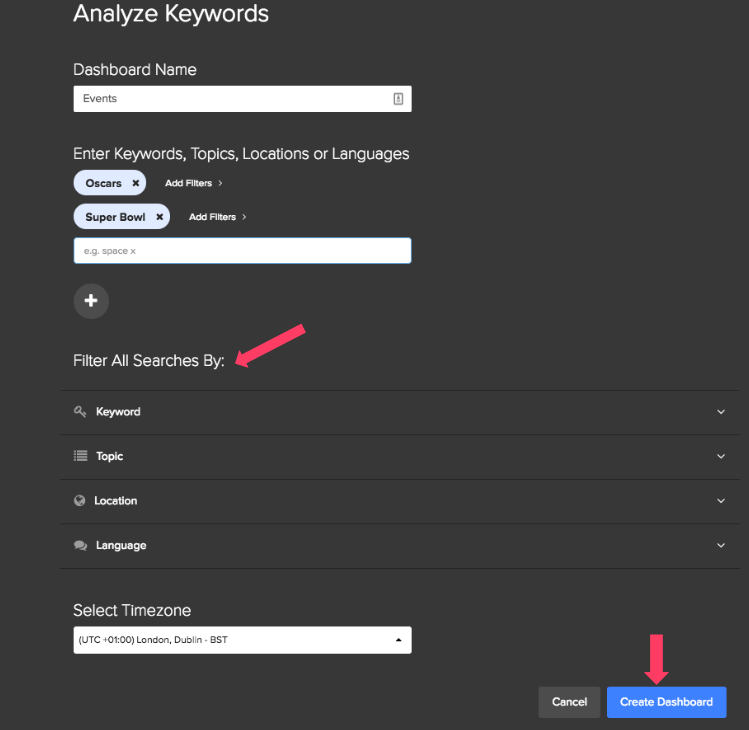
Please refine your query by entering topic, location, or language filters. You can add these filters individually for each keyword or add them across all of your keywords by selecting them from the "Filter All Searches By" section of the form.
Beneath the "Filter All Searches By" section is the dropdown to update the timezone the results are displayed in.
Click the blue "Create Dashboard" button when you're satisfied with the search criteria.

Date Selection
Set a date range using the date picker at the top of the page. Please remember that in Analytics you can search up to 365 day increments in a ~4 year span (from January 2014).
Engagement
Engagement is a combination of likes, shares, comments and reactions on Facebook, Influencer Shares on Twitter, and Pins on Pinterest.

Content Panel
If you want to view the content that comprises the tables and graphs in the default page view, click on the "Content" button on the top right of the page:

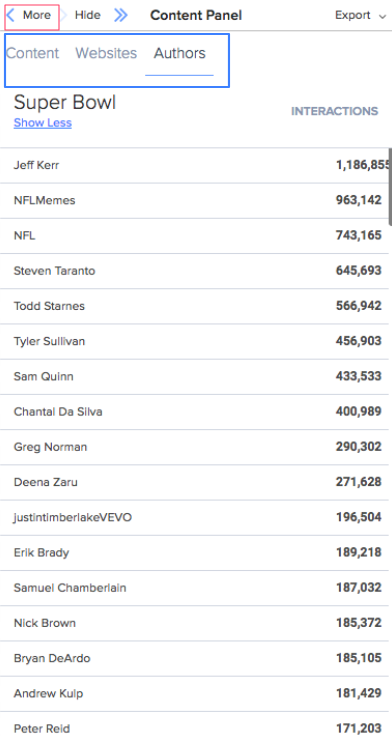
Click the Content button once to see the initial set of results, click on the "More" button in the upper left of the initial pop-out to see the social data breakout.
Using the options highlighted in blue, you can switch between views within your content results:

In this case, we have switched to "Authors". This has updated our results to show the creators of the content. Selecting "Websites" will sort the results by the sites the content appears on.
Exporting
You can export from Analytics in a number of ways.
For graphs and tables, you can export directly to JPEG, PNG, CSV or Excel:

From the Content Panel, you can export to CSV or Excel:

Comments
Please sign in to leave a comment.