The largest database of how audiences have interacted with content around brands, keywords, topics and locations over the past 4+ years.
Use Analytics to conduct historical trend detection, monitoring, and analysis. 1. Create a new Dashboard. (Not sure which dashboard is right? View this article on Types of Dashboards)
2. Select a saved Dashboard. All your Dashboards are visible to all members of your team.
3. Don't forget to set the appropriate date range.
4. The Content Panel shows all the individual places of content that make up the query- e.g. articles, posts, authors - and all of their associated metrics
Editing Dashboards

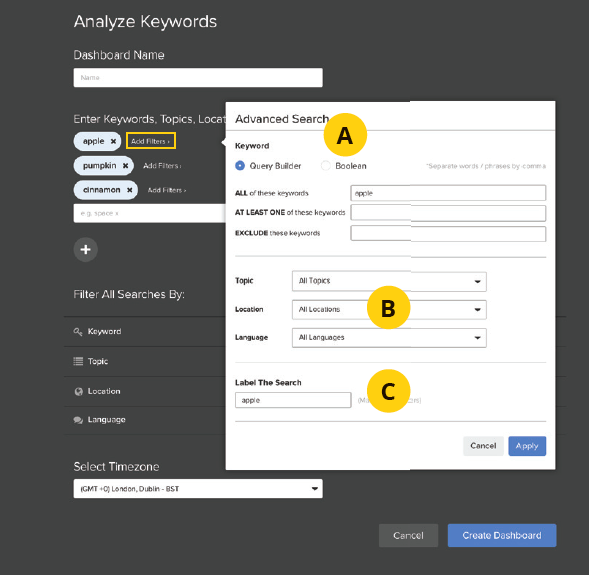
Use the Add Filters link to add additional parameters to each individual query:
A. Use Boolean in your query instead of our default query builder
B. Apply topic, location, or language filters.
C. Label your input. This will determine how it shows on the actual dashboard.
Note: to make filters apply to all input terms in a Dashboard, use the Dashboard Filters option below all of the inputs.
Comments
Please sign in to leave a comment.